Inspection Statistics Archive

Annual Inspections

Below is a breakdown of our annual inspection statistics showing how we inspect the organisations we oversee.

A breakdown of the inspections completed by IPCO in 2023 categorised by organisation type. Total inspections: 386

A breakdown of the inspections completed by IPCO in 2022 categorised by organisation type. Total inspections: 365
A breakdown of the inspections completed by IPCO in 2021 categorised by organisation type.
A breakdown of the inspections completed by IPCO in 2021 categorised by organisation type. Total inspections: 399

A breakdown of the inspections completed by IPCO in 2020 categorised by organisation type. Total inspections: 342

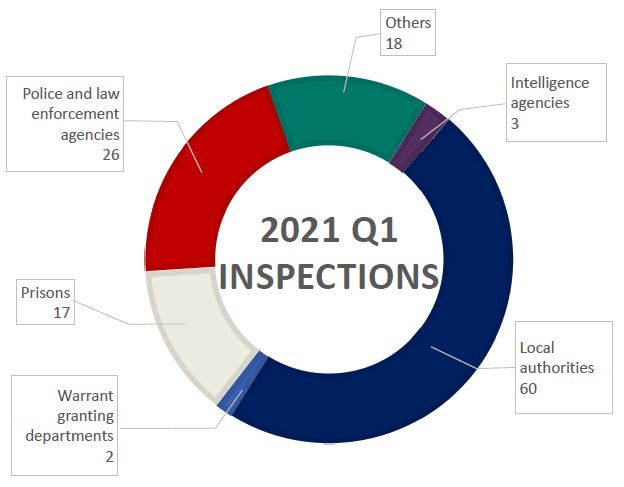
Quarterly inspections

Below is a breakdown of our quarterly inspection statistics showing how we inspect the organisations we oversee.

A breakdown of the inspections completed by IPCO in Q4 2023 categorised by organisation type. Total inspections: 97

A breakdown of the inspections completed by IPCO in Q3 2023 categorised by organisation type. Total inspections: 135

A breakdown of the inspections completed by IPCO in Q2 2023 categorised by organisation type. Total inspections: 69
 
A breakdown of the inspections completed by IPCO in Q1 2023 categorised by organisation type. Total inspections: 85
A breakdown of the inspections completed by IPCO in Q4 (October-December) 2022 categorised by organisation type.
A breakdown of the inspections completed by IPCO in Q3 (July-September) 2022 categorised by organisation type.
A breakdown of the inspections completed by IPCO in Q2 (April-June) 2022 categorised by organisation type.
A breakdown of the inspections completed by IPCO in Q1 (January-March) 2022 categorised by organisation type.
A breakdown of the inspections completed by IPCO in Q4 (October-December) 2021 categorised by organisation type.
A breakdown of the inspections completed by IPCO in Q3 (July-September) 2021 categorised by organisation type.
A breakdown of the inspections completed by IPCO in Q2 (April-June) 2021 categorised by organisation type.
An infographic outlining the number of inspections completed Q1 (January-March) 2021
A breakdown of the inspections completed by IPCO in Q1 (January-March) 2021 categorised by organisation type.

Regional inspections

Inspection periodRegional inspections total
Q1 2021 (January-March)11
Q2 2021 (April-June)31
Q3 2021 (July-September)6
Q4 2021 (October-December)3
Q1 2022 (January-March)4
Q2 2022 (April-June)7
Q3 2022 (July-September)6
Q4 2022 (October-December)7
Q1 2023 (January-March)2
Q2 2023 (April-June)5
Q3 2023 (July-September)4
Q4 2023 (October-December)5
A breakdown of the regional inspections completed by IPCO

Have a question?

Send us a message and we will get in touch as soon as possible

Get in touch

Follow us on LinkedIn and X to keep up to date with IPCO

Check our FAQs for answers to commonly asked questions

Read our FAQs